Plant Hardiness Zone Map
In November 2023 the U.S. Department of Agriculture (USDA) released a new version of its Plant Hardiness Zone Map (PHZM), updating this valuable tool for gardeners and researchers for the first time since 2012. The map is the standard by which gardeners and growers can determine which plants are most likely to thrive at a location.
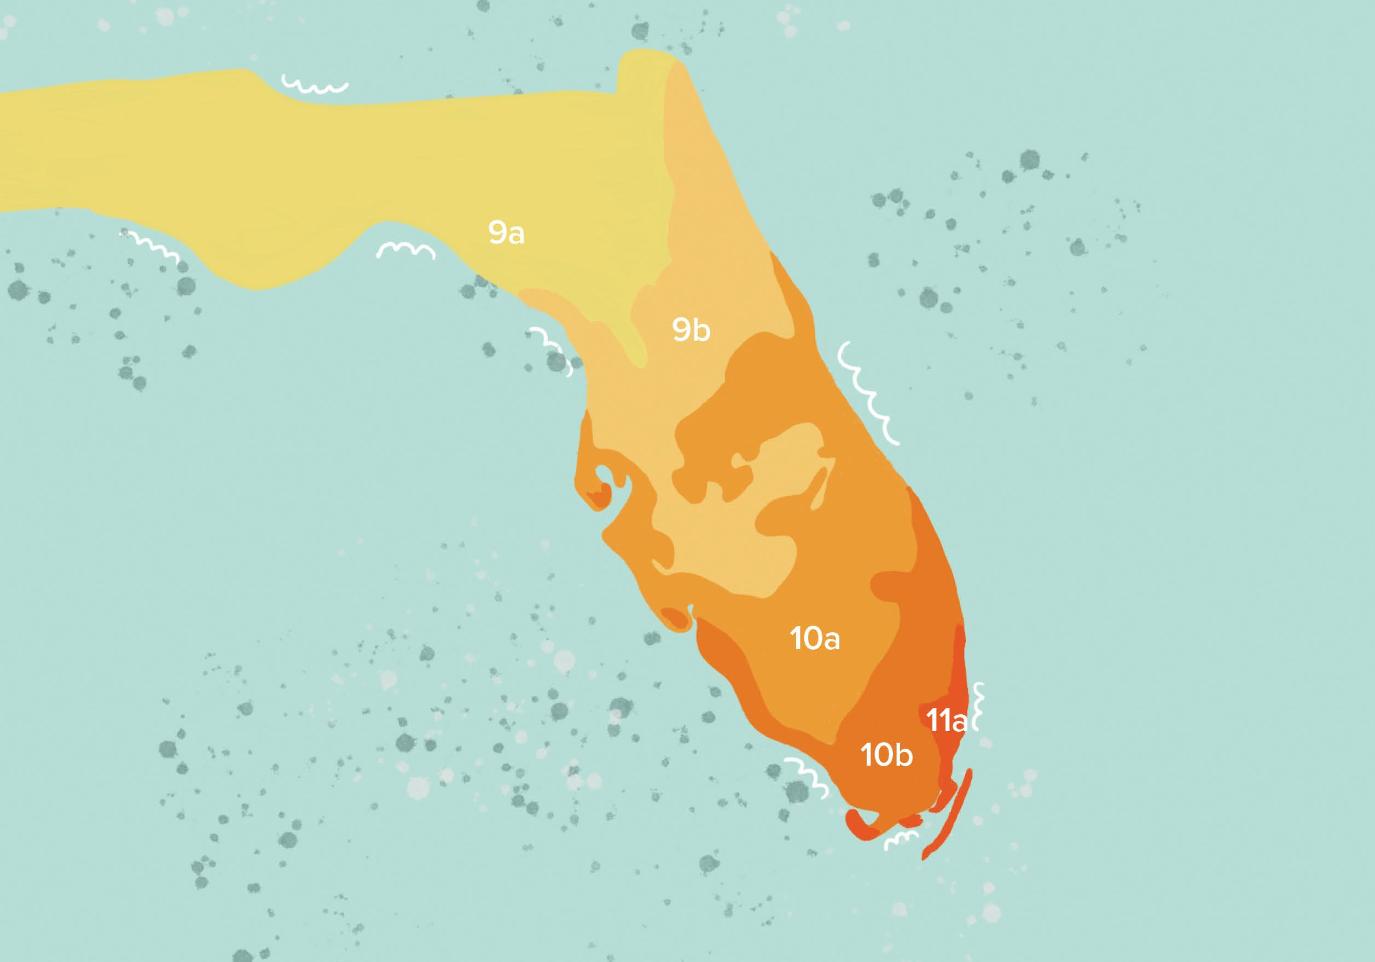
The map is based on the average annual extreme minimum winter temperature, displayed as 10-degree Fahrenheit zones ranging from zone 1 (coldest) to zone 13 (warmest). Each zone is divided into half zones designated as "a" and "b." For example, 9a and 9b are 5-degree F increments representing the colder and warmer halves of zone 9, respectively.
Zones in this edition of the USDA PHZM are based on the average lowest temperatures in the 1991-2020 weather data, not the lowest ever. This does not represent the coldest it has ever been or ever will be in an area, but it simply is the average lowest winter temperatures for a given location for this 30-year span.
Hardiness is used to describe a plant's ability to withstand cold temperatures. If a plant is “hardy” it often tolerates temperatures below freezing; a “tender” plant has little or no tolerance to temperatures below freezing. Hardiness zones are a convenient shorthand used in commercial nurseries and plant suppliers, on seed packs and by farmers, home gardeners, landscape designers and professional horticulturists to select plants for a given location. The new version is more accurate and contains greater detail than prior versions; it shifted many locations by a half zone, reflecting weather trends towards average warmer winter temperatures.
According to the updated map, Northeast Florida is zone 9 with variations in half zone as you move towards the center of the state. Duval County west of the 295 W beltway is considered hardiness zone 9a while the eastern half of Duval is 9b.
Zone 9b stretches along the east coast of Florida from the Georgia border down to Ormond Beach and then dips down into central Florida. In zone 9b the average low temperature is 25-30 degrees.
Zone 9's average low increased 2-3 degrees since 2012. This gradual heat increase will not greatly affect well established perennial plants. However, if the trend continues, Northeast Florida runs the risk of losing its traditional southern temperate plants that like a cold hard winter. For instance, hydrangeas are affected by the heat with less blooms, smaller blooms, shorter bloom windows and persistent fungus when compared to hydrangea productivity 30 years ago in our climate.
As the hardiness zone increases the perennial plant options in Northeast Florida become more tropical and tender.
The USDA Plant Hardiness Zone Map is simple and easy to use. Enter your zip code in the search bar at the top at planthardiness.ars.usda.gov. The map will generate your hardiness zone for 2023 and display your previous 2012 hardiness zone. The map also displays the average temperature change from 2012-2023. For Northeast Florida zone 9b, previously zone 9a, there was an average low that was three degrees warmer.